Here at Labstep, we've always championed the power of structured data in scientific discovery. We understand that meticulous tracking of every detail – from precise reagent volumes to incubation times – is the cornerstone of reproducible and insightful research. We believe that having this data structured and centralized allows you to optimize processes and spot patterns across different experiments that might otherwise remain hidden.
For years, our focus has been on streamlining data entry, making it as seamless as possible to capture every crucial detail of your lab work. We’ve built a robust system that ensures your data is not just stored, but structured for maximum utility.
Thanks for joining us today! Can you tell us about your role at Labstep?
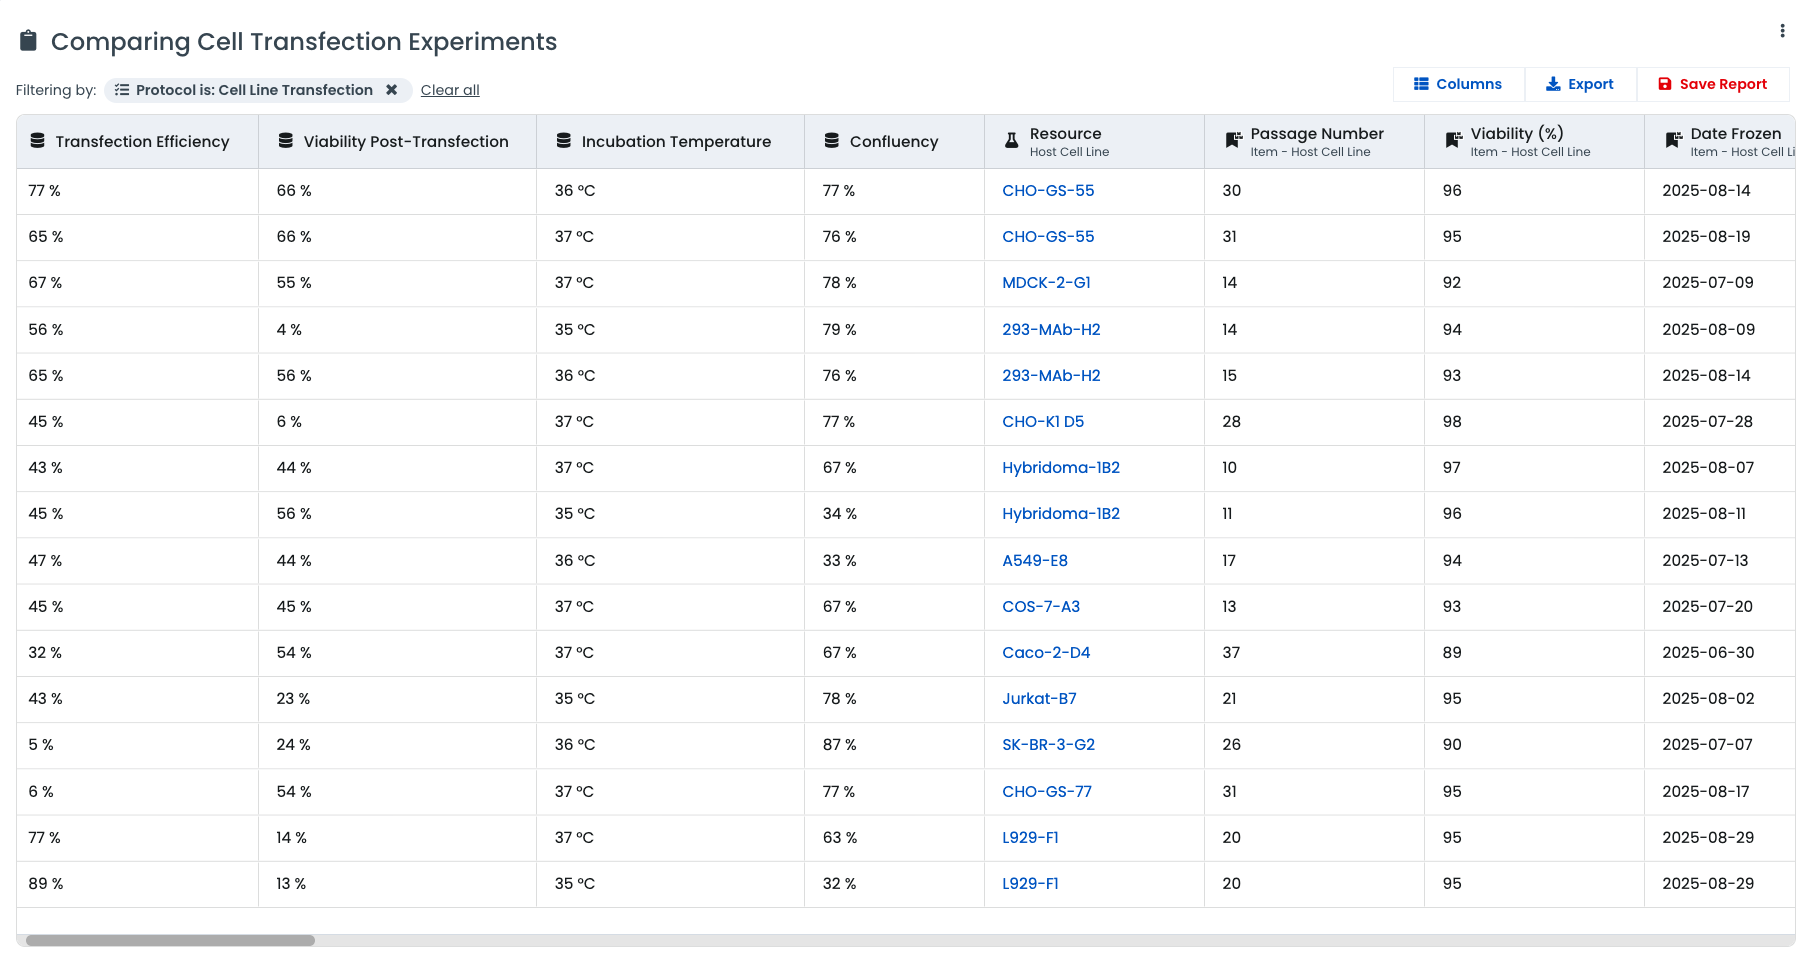
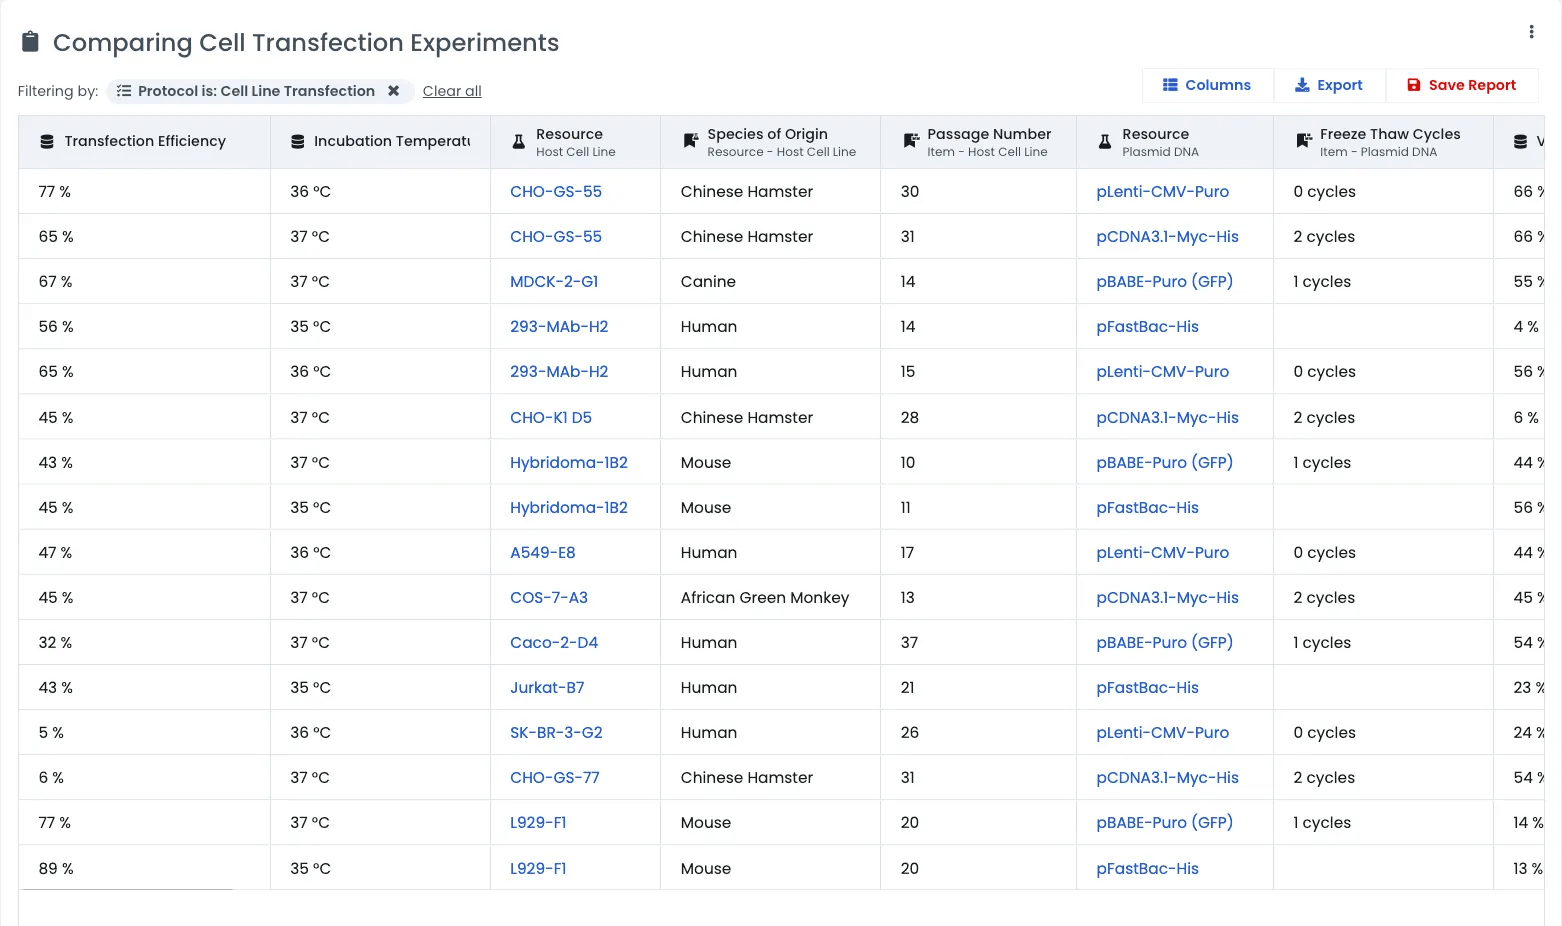
While all your Labstep data has always been accessible via our API, we're thrilled to take the next step: bringing the power of data exploration directly into the application itself. We're launching the first version of our new Reporting Module, designed to empower you with the ability to compare data generated by the same protocol across all your experiments and experimental conditions.
Uncovering Hidden Trends: Example Use Cases
This isn't just about viewing data; it's about transforming it into actionable insights. The Reporting module empowers you to compare experimental outcomes, input parameters, and inventory, revealing connections that were previously obscured.
Here are a few examples illustrating its potential:
Example Use Case 1: Optimizing Cell Line Performance
- The Scenario: You work for a biotech company that has been working with a particular cell line for several years, using it to produce a valuable therapeutic protein. Over time, you've run hundreds of experiments, testing various growth factors, media formulations, and culture conditions. You've diligently recorded all the data in Labstep, but it's scattered across numerous experiment entries.
- The Problem: While the cell line works, you suspect there's significant room for improvement in terms of yield and consistency. Small variations in your process have led to batch-to-batch variability, affecting downstream processing and ultimately product quality.
- The Solution: With the new Reporting module, you can now aggregate all the historical data related to this cell line. You can compare cell viability and proliferation rates across all those past experiments, even those where media formulation was just a minor variable.
- The Insight: By analyzing the data, you discover that a specific lot of a particular growth factor, used inconsistently over the years, had a surprisingly strong positive effect on cell viability. This growth factor was not the focus of any single experiment, but the Reporting module reveals its hidden influence.
- The Impact: You can now incorporate this optimal growth factor lot consistently into your standard operating procedure, leading to a significant increase in protein yield and reduced batch-to-batch variability.
What was your journey that led you to Labstep?
Example Use Case 2: Improving Protein Expression & Purification
- The Scenario: You're part of a research team in an academic lab that has been studying a novel protein for the past few years. You've expressed this protein using various expression vectors in E. coli, testing different induction times and temperatures. All the data, including expression levels (from Western blots) and final purity (from HPLC), has been recorded in Labstep.
- The Problem: The protein expression levels have been inconsistent, and the purification process is inefficient, often resulting in low yields of the desired purity. This inconsistency is slowing down your research.
- The Solution: The Reporting module allows you to consolidate all the protein expression data from past experiments. You can compare expression levels and final purity against the different expression vectors and induction times used.
- The Insight: You discover that a particular expression vector, which you had initially dismissed as being only moderately effective, consistently produced the highest yield of protein with the best purity when combined with a slightly longer induction time than previously used. This optimal combination was not obvious from any single experiment but emerges clearly from the aggregated data.
- The Impact: You can now switch to this optimal expression vector and induction time, dramatically improving your protein production efficiency. This accelerates your research and saves valuable time and resources.
You mentioned a “reproducibility crisis.” What does that mean?
Example Use Case 3: Optimizing Polymerization Reactions
- The Scenario: You work at a chemical company that has been developing a new polymer for use in advanced materials. Over the past few years, you've conducted numerous small-scale polymerization reactions, testing different catalysts, temperatures, and monomer ratios. The primary objective of these experiments was to explore the range of achievable polymer properties, not to optimize the reaction for maximum efficiency. All experimental data, including polymer molecular weight and mechanical properties, is stored in Labstep.
- The Problem: As you move towards scaling up production, you face challenges with achieving consistent polymer properties. You notice that slight variations in the reaction conditions seem to have a significant impact on the final product.
- The Solution: The Reporting module enables you to analyze all your historical polymerization data. You can compare polymer properties (molecular weight, tensile strength, etc.) across the different reaction parameters used in all those past experiments.
- The Insight: You identify a subtle but crucial interaction between the reaction temperature and the monomer ratio. You discover that a slightly higher temperature, combined with a specific monomer ratio (which was not previously considered optimal, results in a significant improvement in polymer strength and consistency. This interaction was not apparent from the individual experiments but is revealed by the comprehensive data comparison.
- The Impact: Your company can now implement this optimized reaction condition in its large-scale production process, leading to a more consistent and higher-quality polymer product. This improves manufacturing efficiency and the reliability of the final product.
Are most of your customers using an existing ELN? What do you do when a client comes to you with a shoe box filled with post-its?
The Future of Data-Driven Discovery
These examples illustrate how the Labstep Reporting module can transform historical data into actionable insights, enabling scientists to optimize their processes and improve their outcomes, even from experiments not originally designed for that purpose.
This first version of the Reporting module is just the beginning. We're committed to continually enhancing its capabilities, adding more powerful analytical tools and visualization options. Our goal is to make Labstep the central hub for all your scientific data, empowering you to make data-driven decisions and accelerate your research.
We encourage you to explore the new Reporting module and discover the hidden insights within your data. We're excited to see how you use it to advance your research and drive innovation.
Start exploring your data today!
What is something that really impresses your customers during their first few months using the Labstep ELN?
It sounds like an ELN could be good for sustainability and conservation of resources.
What makes you most excited about joining with STARLIMS?